How to open the sessions drilldown for a SQL Server connection
- Direct your web browser to https://app.spotlightcloud.io. Sign in with your Quest account.
- Ensure the Monitoring tab is to the front.
- Select a SQL Server connection type. Select the sessions drilldown.
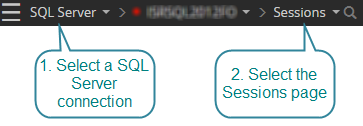
SQL Server connection types are: SQL Server instance, Azure SQL Managed Instance, Amazon RDS for SQL Server.
Sessions summary

Sessions
Show the number of active and inactive sessions.
Throughput
Show the rate of …. transactions, batches, logons
Blocked
Show the number of blocked sessions.
CPU
Show the percentage of CPU used by the operating system and databases.
Outstanding alarms
Show the number of outstanding alarms of each severity related to the sessions drilldown. Click to open the alarms panel to drilldown on these alarms.
Sessions panel
The sessions panel lists all active and foreground sessions. Select a session to show more data on the selected session.
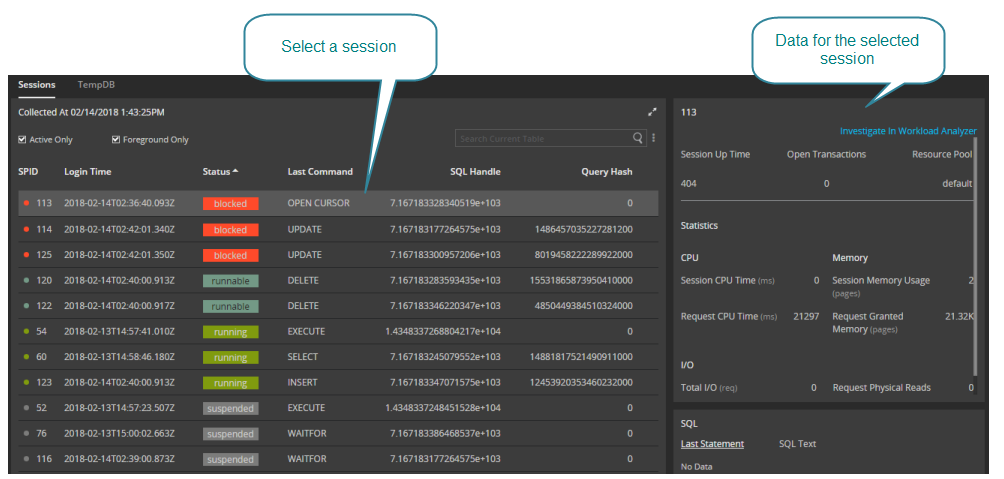
De-select the Active Only and Foreground Only check boxes to show more sessions.
SPID
Number that SQL Server has assigned to uniquely identify the session.
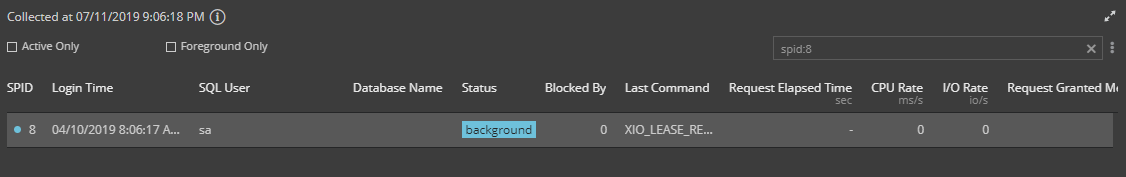
You can use the search field to filter on a specific SPID. In the search field type spid:8 where 8 is the SPID number.
Login Time
Time the session was created.
Status
Status of the session (runnable, sleeping, blocked etc).
Last Command
Current or previous command executed.
SQL Handle
Identifier for the SQL. Note the SQL handle is available only when the session is executing.
Query Hash
Additional statistics for the Sessions panel
Click  in the top right corner of the panel to see the full session statistics.
- CPU Rate - The CPU time the session used per second. Use this column to observe sessions with high recent CPU usage.
- I/O Rate - The number of I/O requests serviced per second. Use this column to observe sessions with high I/O usage.
- Request Granted Memory (pages)
- Request Logical Reads
- Request Physical Reads
- Request Writes
- Last Batch Time - Time the last batch started execution.
- Time Since Last Batch - Elapsed time since the last batch started execution.
- Total I/O
- Total Logical Reads - Number of logical reads performed for the session.
- Total Physical Reads - Number of physical reads performed for the session.
- Total Writes - Number of physical writes performed for the session.
- Last Statement
- SQL Text
TempDB panel
Click the TempDB tab to open the TempDB panel. Select a session for more statistics on the selected session.
Requires Spotlight Cloud ProfessionalSPID
The ID of the session generating Tempdb usage.
SQL user
SQL Server login name for this session.
Program
Program the user is running to access SQL Server.
Host Name
Name of the client computer.
Current Allocated Size
User Objects Size
The total space used by user objects in this session.
Internal Objects Size
The space consumed by internal objects in all tasks in this session.
TempDB panel (additional statistics)
Click in the top right corner of the panel to see the full session statistics.
- Status - Status of the session (runnable, sleeping, blocked etc).
- Waiting On
- Current Wait Time - Amount of time this session has been waiting. It shows 0 if the session is not currently waiting.
- Total Allocated Size
Panel for the selected session
Select a session from the Sessions / TempDB drilldown to show statistics for the selected session.
Session Up Time
Open Transactions
Resource Pool
Statistics
CPU
- Session CPU Time (ms)
- Request CPU Time (ms)
Memory
- Session Memory Usage (pages)
- Request Granted Memory (pages)
I/O
- Total I/O (req)
- Request Physical Reads
SQL
SQL Text requires Spotlight Cloud Professional- Last Statement
- SQL Text