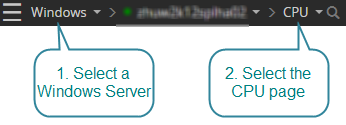
How to open the CPU drilldown for a Windows Server connection
- Direct your web browser to https://app.spotlightcloud.io. Sign in with your Quest account.
- Ensure the Monitoring tab is to the front.
- Select a Windows Server connection. Select the CPU drilldown.

OS CPU
CPU
Shows the number of processors used by the operating system.
Under most circumstances, this will be the same as the number of installed processors, but can differ - either because of firmware/hardware controls on the system or by use of the /NUMPROC boot.ini option.
Speed
Shows the speed of the processor(s) installed on the monitored Windows Server.
Type
Shows the processor type - usually a vendor code.
CPU utilization
Shows the utilization of the CPU on the Windows server.
Processes
Shows the number of applications and services that are currently active on the Windows Server.
Threads
Shows the number of threads currently active in all processes. A thread is a running portion of the owning process. Every process has at least one thread.
Queue length
Shows the number of threads (program execution units) that are waiting to run on all processors. A sustained processor queue length greater than 10 can indicate processor congestion.
CPU utilization
Shows the CPU utilization for all user and system processors on the Windows Server.
Time series charts
Interrupts
Shows the number of interrupts per second per CPU on the Windows server. Each CPU is represented by a single graph on the chart, and by an item in the legend at the top right of the chart.
The Interrupts chart is designed to show if any CPUs on the system are bearing a disproportionate level of the I/O load.
Server work queues
Shows the number of threads (program execution units) that are waiting to run on each processor. A sustained queue length greater than four may indicate processor congestion.
Kilobytes transferred
Shows the number of kilobytes per second transferred per CPU on the Windows Server. Each CPU is represented by a single graph on the chart, and by an item in the legend at the top right of the chart.
Processor queue length
Shows the total number of threads (program execution units) that are waiting to be run on ALL processors. A sustained processor queue length greater than ten can indicate processor congestion.
Context switching
Shows the rate at which Windows has been processing context switches.
A Context Switch occurs when a processor switches from one thread to another. Context switches occur when a running thread voluntarily relinquishes the processor, is preempted by a higher priority ready thread, or switches between user-mode and privileged (kernel) mode to use an Executive or subsystem service.
Total processes & threads
Shows the total number of Windows processes and threads that exist.
A process is one instance of an application program or system service that is currently executing on the server. Each process will have one or more threads which are the basic entity that can be scheduled. Sophisticated application processes such as SQL Server or Exchange can have dozens of threads running concurrently.
Top CPU consumers
CPU usage of commands run on the Windows Server.
Maximize this chart to show the CPU usage of each command over time.