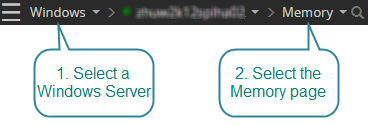
How to open the memory drilldown for a Windows Server connection
- Direct your web browser to https://app.spotlightcloud.io. Sign in with your Quest account.
- Ensure the Monitoring tab is to the front.
- Select a Windows Server connection. Select the memory drilldown.

Time series charts
- Physical Memory Usage
- Paging Rate
- Cache Hit Ratio
- Cache Size
- Writes number
- Physical Cache I/O
- Virtual Memory
- Page File Transfers
- Hard vs Soft Faults
- Commit Limit
- Committed Bytes
- Free Physical Size
- Free Physical Memory
- Free System Page Table Entries
- Free Virtual Memory
- Free Virtual Memory Size
- Page Faults
- Page Hit Ratio
- Page Faults Rate
- Page Reads
- Page Reads Rate
- Pages
- Pages Input
- Pages Input Rate
- Pages Output
- Pages Output Rate
- Pages Write
- Pages Write Rate
- Physical File Cache
- Physical Kernel
- Physical Kernel Size
- Physical Nonpaged Pool
- Soft Faults Rate
- Total Pages Rate
Top processes
Shows information on top processes (or programs) currently running on the system.
Page files
Shows information about the page files in use by Windows.
Page files are disk files that the Windows Virtual Memory Manager uses to back up physical memory. Code and data is moved between physical memory and the page files as required, giving processes on the system the illusion that there is much more physical memory available than there really is. The process of moving data and code between memory and disk is called paging.