How to open the alarms panel
Click  - top right of the heatmap, overview page or drilldown page.
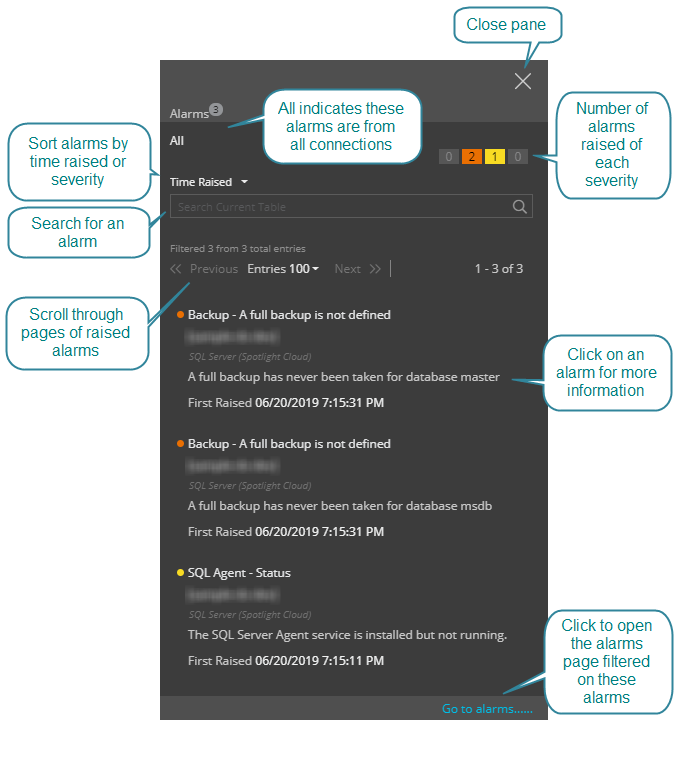
Anatomy of the alarms panel
Alarms can be sorted by time or severity. If many alarms have been raised then use the search feature to search for an alarm and the next and previous links to page through the list of alarms. Click on an alarm for more information.
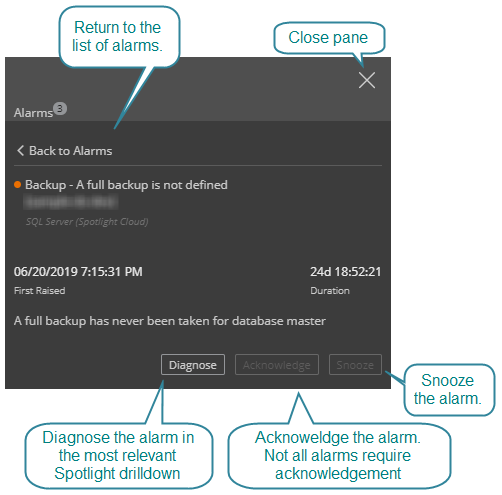
Alarm analysis
Select an alarm from the list of alarms. Dependent on the alarm, Spotlight Cloud shows:
- A description of the alarm.
- Analysis of data on the Summary tab as a time series chart or table of related data or both.
- More on why this alarm may happen on the Background tab.
- Suggestions for what to do next to resolve the alarm on the Suggestions tab.
Click Diagnose to open the most relevant Spotlight drilldown for further analysis of the data. Click Acknowledge to acknowledge the alarm. Click Snooze to snooze the alarm.
Where a chart is displayed, hover your mouse over the chart to see the chart legend and cartesian co-ordinates.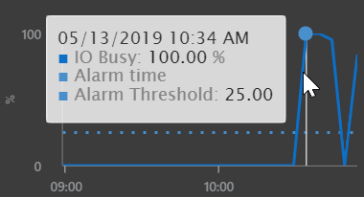
If you have a Spotlight Cloud Professional subscription and you click Diagnose then the drilldown page will open in the time period leading up to the time the alarm was raised. This time period will stick for any future monitoring screens you browse to for this connection until you change connections, change the time period or Reset to real time monitoring.
For more on alarms, see also the alarms page.