Charts
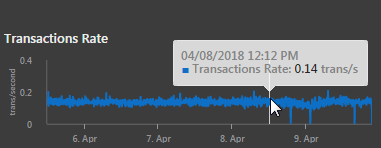
Hover your mouse over a chart to see data specific to that chart such as the legend and cartesian co-ordinates.
Tables
Show hidden columns
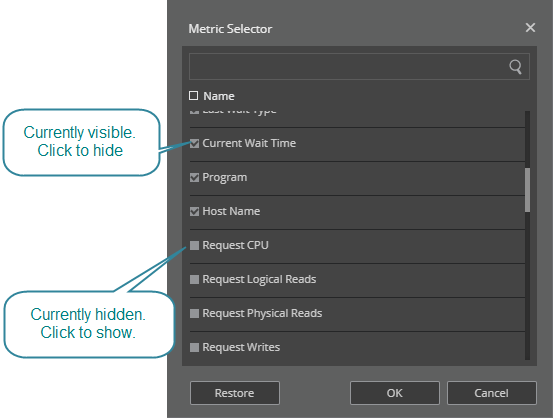
Many tables have additional information in hidden columns. You can show / hide any column of the table using the “three dots” icon to the right of the search bar. 

This opens the Metric Selector dialog. From this dialog you can see all available columns of data. Click the icon to the left of the column header to tick (show) or untick (hide) the column.
Search
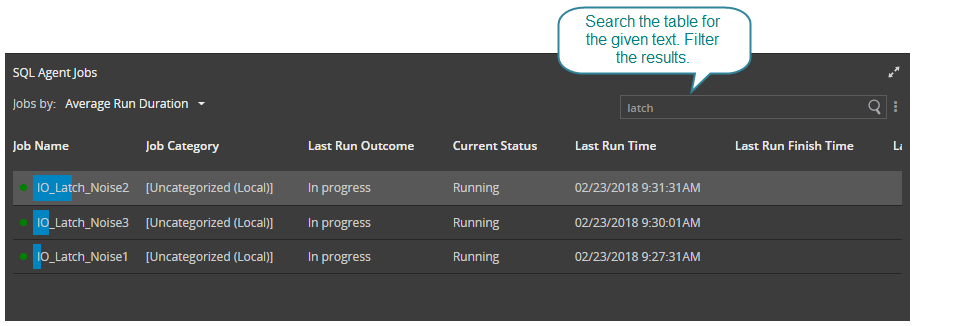
Use the search bar to search all the rows and columns of a table for given text.
Sort
This table is sorted in descending order of the data size column. The data size column values are overlaid on the table in the form of a bar chart.
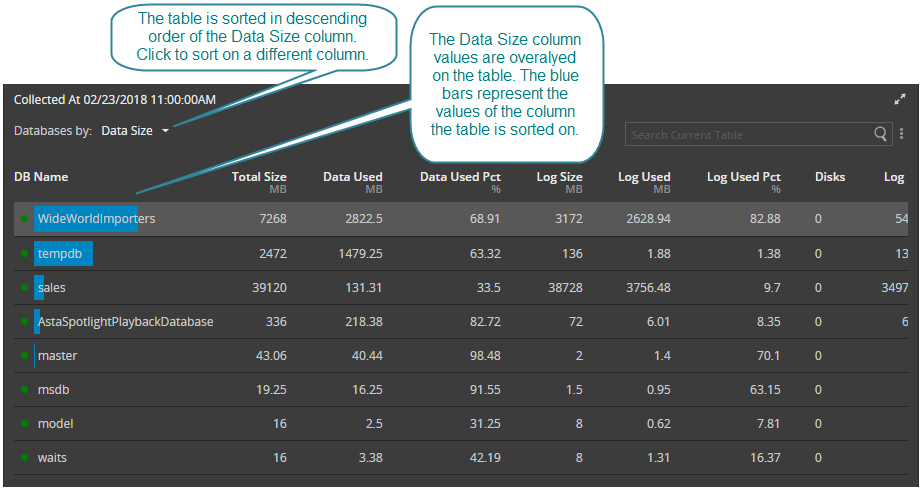
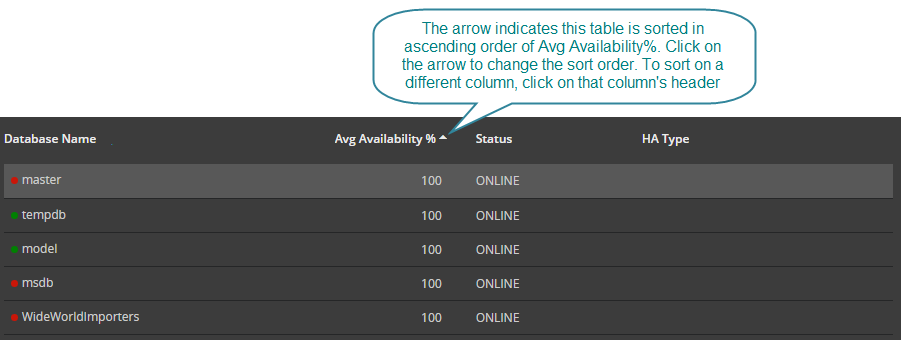
For some tables an up/down arrow to the right of the column header indicates the column the table is sorted on and whether the sort is ascending or descending. Click on the arrow to change the sort order. To sort on a different column, click on that column’s header.
