Open the Spotlight overview page
If there are many connections on the Spotlight Cloud Mobile display, as per a heatmap or connections display, tap on the Spotlight connection to open the Spotlight overview page for that connection.
 If the Spotlight Cloud Mobile display is already focused on a single connection then tap the Spotlight overview page icon to return to the Spotlight overview page for that connection.
About the Spotlight overview page
A Spotlight overview Page is made up of panels, flows and components updated in real time to highlight obvious bottlenecks and problem areas and color coded to indicate when an alarm is raised.
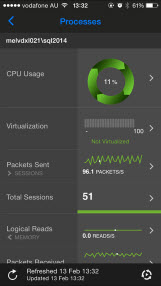
Panels
The front page of the Spotlight overview page shows the panels. If a panel’s color is other than green then at least one of the panel’s components is in an alarm state. The panel is colored according to the severity of the highest alarm raised against a panel component. Tap the panel to show the panel’s components.
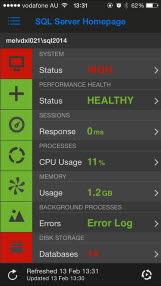
Flows and components
If a component’s color is other than green then the component is in an alarm state. Tap the component to show the alarms raised against the component.
If the component’s color is green then tap the component for help on the component.