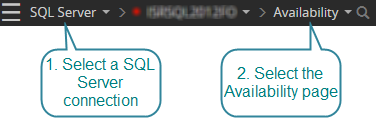
How to open the availability drilldown for a SQL Server connection
- Direct your web browser to https://app.spotlightcloud.io. Sign in with your Quest account.
- Ensure the Monitoring tab is to the front.
- Select a SQL Server connection type. Select the availability drilldown.
SQL Server connection types are: SQL Server instance, Azure SQL Managed Instance, Amazon RDS for SQL Server.
For Always On availability groups additional monitoring details and diagnosis are available. See also the Availability Group alarms under SQL Server alarms.
Instance panel

 Status
A green (up) triangle indicates the instance is available. This is replaced with a red (down) triangle when the instance is unavailable, and a hyphen (-) when the availability of the instance is unknown.
Uptime
Show the number of days, hours and minutes that the instance has been available.
Availability during the last 1 hour
Show the proportion of time over the last hour that the instance has been available.
Use the drilldown time period controls to show the proportion of time the instance has been available over other time periods.
Monitoring agents
The controls are colored according to the highest severity alarm raised during the drilldown time period, where the alarm is one of the following Monitored Server alarms: collection execution failure, unsupported version, alarm action failure, alarm evaluation failure.
DB is colored according to the highest severity alarm raised for the SQL Server instance. OS is colored according to the highest severity alarm raised for the SQL Server host operating system. OS is colored gray if the operating system is not monitored.
Use the drilldown time period controls to customize the time period.
Available databases
Show the number of databases on this instance and the number of those databases that are available.
Configuration
Indicate the current configuration status for Clustered and Always On.
Hostname
Show the name of the host of this instance. If the host is monitored by Spotlight Cloud then click on the hostname to open the Spotlight Overview page for the host.
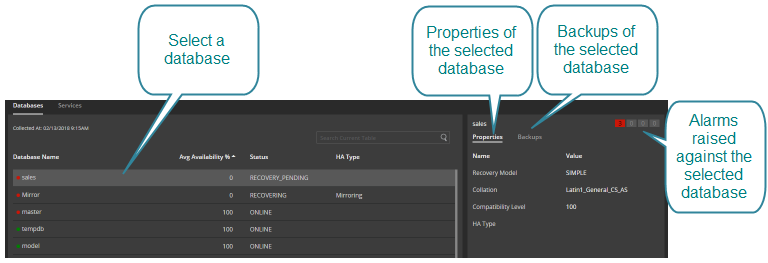
Outstanding alarms
Show the number of outstanding alarms of each severity related to the availability drilldown. Click to open the Alarms panel to drilldown on these alarms.
Databases panel
 Severity
Colored according to the highest severity SQL Server availability alarm raised over the time period covered by the drilldown.
Database name
Show the name of the database.
Avg availability %
Show the average availability of the database over the drilldown time period.
Status
Show the status of the database as in ONLINE, OFFLINE, RESTORING.
HA type
Show the high availability type: MIRRORING, LOG SHIPPING, AVAILABILITY GROUP, NONE.
All applicable types are shown. Multiple types are comma separated.
When a database is selected that is part of an Always On availability group, additional details and diagnosis are available on the selected database pane, Availability Group tab.
Last full backup
Show the date and time of the last full backup.
Last log backup
Show the date and time of the last log backup.
Last different backup
Show the date and time of the last differential backup.
Selected database panel
Show data for the selected database.
Outstanding alarms
Show the number of outstanding alarms of each severity related to the selected database. Click to open the alarms panel to drilldown on these alarms.
Properties tab
Show properties of the selected database.
- Recovery model
- Collation
- Compatibility level
- HA type
Possible HA types are MIRRORING, LOG SHIPPING, AVAILABILITY GROUP, NONE. The properties tab shows all types applicable to the selected database. Multiple types are comma separated.
Availability group tab (primary replica)
Show where the selected database is a primary replica of an Always On availability group:
- Availability Group
- Current Replica Role: Primary
- Failover Mode: MANUAL, AUTOMATIC.
- Last Commit Time
If the failover mode is automatic then this replica is a potential target for automatic failovers. Automatic failover is supported only if the availability mode is set to synchronous commit and the availability replica is currently synchronized. If the failover mode is set to manual then a failover to a secondary replica set to manual failover must be manually initiated by the database administrator and the type of failover that is performed will depend on whether the secondary replica is synchronized. If the replica is not synchronizing or is still synchronizing then for manual failover mode only forced failover (with possible data loss) can occur.
Table of secondary replicas Show the secondary replicas for this Always On availability group and help to answer the question: Is this database ready for failover? Show for each secondary replica:
- Replica id
- Mode - For example, Synchronous or Asynchronous
- State - For example, Synchronized or Synchronizing
- Health - Show the health of the database on this secondary replica as HEALTHY, PARTIALLY HEALTHY or NOT HEALTHY.
- Est Recovery Time (sec) - Estimated recovery time in seconds.
- Est Data Loss (sec) - Estimated data loss time in seconds.
Availability group tab (secondary replica)
Show where the selected database is a secondary replica of an Always On availability group:
- Availability Group
- Current Replica Role: Secondary.
- Failover Mode: MANUAL, AUTOMATIC.
- Availability mode
- Synchronization State
- Synchronization Health: Show the health of the database on this secondary replica as HEALTHY, PARTIALLY HEALTHY or NOT HEALTHY.
- Suspend Reason
- Last Commit Time
- Estimated recovery time (sec)
If the failover mode is automatic then this replica is a potential target for automatic failovers. Automatic failover is supported only if the availability mode is set to synchronous commit and the availability replica is currently synchronized. If the failover mode is set to manual then a failover to a secondary replica set to manual failover must be manually initiated by the database administrator and the type of failover that is performed will depend on whether the secondary replica is synchronized. If the replica is not synchronizing or is still synchronizing then for manual failover mode only forced failover (with possible data loss) can occur.
If the availability mode is asynchronous commit then the primary replica can commit transactions without waiting for the secondary to write the log to disk. If the availability mode is synchronous commit then the primary replica waits to commit a given transaction until the secondary replica has written the transaction to disk. If the availability mode is configuration only (SQL Server 2017 CU1 and later) the primary replica sends availability group configuration metadata to the replica synchronously and user data is not transmitted to the replica.
Time series charts on the secondary replica Show the latency between the primary and secondary replicas over time. Show:
- Avg Redo Rate (KB/sec) - Average rate at which the log records are being redone on the secondary replica.
- Redo Queue Size (KB) - The number of log records in the log files of the secondary replica that have not yet been redone.
- Log send rate (KB/sec) - Average rate at which the primary replica instance sent data during last active period.
- Log send queue size (KB) - The number of log records for the primary database that have not been sent to the secondary databases.
Backups tab
Show for data the selected database:
- Last backup time
- Last full backup time
- Last different backup time
- Last log backup time
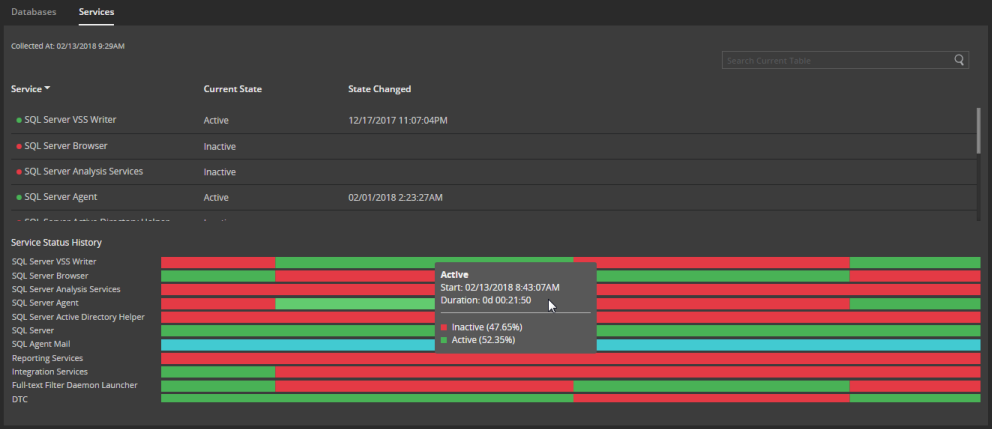
Services panel
For each SQL Server service, show the current state as active, inactive or not configured and when the state last changed. The under chart provides a history of SQL Server services. Hover the mouse over the chart for more detail.