How to open the TempDB usage drilldown for a SQL Server connection
- Direct your web browser to https://app.spotlightcloud.io. Sign in with your Quest account.
- Ensure the Monitoring tab is to the front.
- Select a SQL Server connection type. Select the TempDB usage drilldown.

SQL Server connection types are: SQL Server instance, Azure SQL Managed Instance, Amazon RDS for SQL Server.
TempDB panel

Usage
Shows in proportion the usage of tempDB by Internal Objects, User Objects and Free Space.
Auto growth
Is Auto Growth on or off for this SQL Server instance?
Outstanding alarms
Show the number of outstanding alarms of each severity related to the TempDB drilldown. Click to open the Alarms panel to drilldown on these alarms.
Usage/contention panel

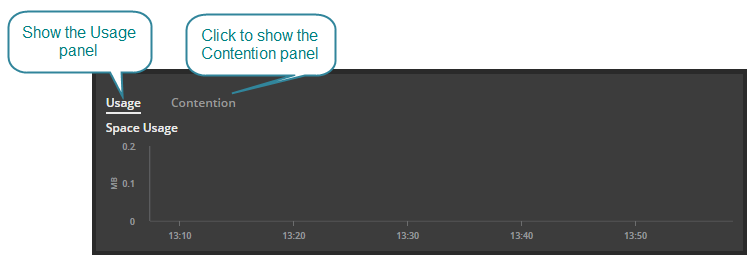
Usage
The Space Usage chart represents “points in time” usage.
| Legend | Description |
|---|---|
| User objects | System tables and indexes, user defined tables and indexes, global temporary tables, local temporary tables and indexes, table variables and tables returned in table-valued functions. |
| Internal objects | Work tables (for cursors, spool operations, temporary large objects LOBs), work files (for hash join and hash aggregate operations), intermediate sort results (for rebuilding indexes, group by, order by and union) |
| Version store | There are two version stores in Tempdb. The online index build version store is used for online index builds in all databases. The common version store is used for all other data modification operations in all databases. |
| Free space | Unused space |
Contention
Click the Contention tab to see the Wait Time Chart. The Wait Time chart plots wait contention over time for the resource types PFS (page free space), GAM (global allocation map) and SGAM (shared global allocation map).
Files panel

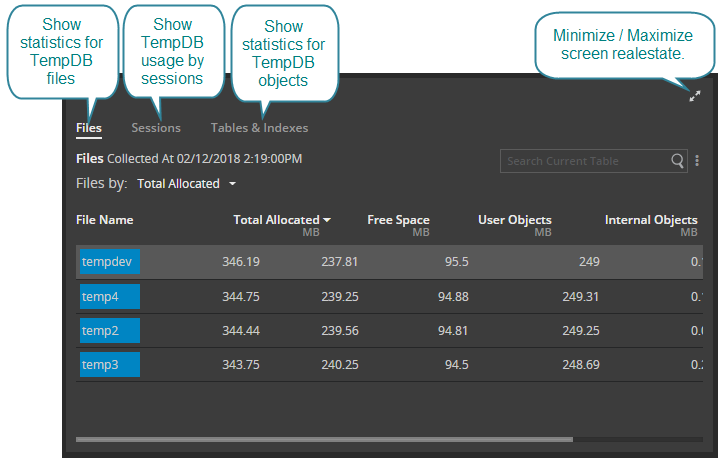
Files
Show statistics for TempDB files.
Sessions
Click the Sessions tab to show TempDB usage by sessions.
Tables & Indexes
Click the Tables & Indexes tab to show statistics for TempDB objects.
Version Store Analysis
Compare at a glance the rate of growth to the rate of cleanup.
Create Objects Rate
Shows the rate at which temp tables are created.
Performance Indicators
A display of key performance indicators such as:
- Oldest Transaction Running Time
- Total Version Transactions
- Average Version Transaction Rate
- Active temp tables
- Temp Tables for Destruction
Analytics panel
Activity highlights
Spotlight Cloud summarizes the current situation. Is the version store currently growing? What is the current size of the version store? Is there significant TempDB contention on the SQL Server instance?
Advisories
Click the Advisories tab on the Analytics panel. Spotlight Cloud provides advice based on the latest configuration.
 Click to show/hide the analytics panel.