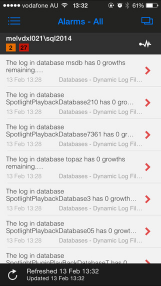
How to open the alarm list
 Tap the alarms icon from the heatmap or Spotlight overview page to open the alarms list.
How to use the alarm list
Each alarm is colored according to the severity of the alarm. Tap the row for alarm details, to snooze alarm or acknowledge alarm.
On an iPad, tap the colored icon.

Sort or group the alarms
Tap the icon. Sort by date or severity. Group by server, severity or alarm.
| Android | iPhone |
|---|---|
 |
Tell me about each alarm
Information about each alarm is documented under the connection type.
- Azure SQL Managed Instance
- Amazon RDS for SQL Server
- SQL Server instance alarms
- SQL Server replication alarms
- Windows Server alarms
- Diagnostic Server alarms
Color
The alarm, connection or connection view is colored according to the most severe current alarm.
| Color | Severity | Description |
|---|---|---|
| Normal | No alarms are raised against this connection. | |
| Information | At least one information alarm is raised against this connection. No other alarms are raised. | |
| Low | At least one low severity alarm is raised against this connection. No high or medium severity alarms are raised. | |
| Medium | At least one medium severity alarm is raised against this connection. No high severity alarms are raised. | |
| High | At least one high severity alarm is raised against this connection. |